
Chiang Mai Air Quality in March: What to Expect, Week by Week and Year by Year
Why Is Chiang Mai Air Quality Bad? How Smoke, Weather and Geography Combine
Poor air quality in Chiang Mai comes from forest fires, crop burning and cross-border smoke — trapped by mountains and still air. The evidence behind the haze.
20 min read
By Daniel Calleja, founder of The Chiang Mai Brief and Chiang Mai resident.
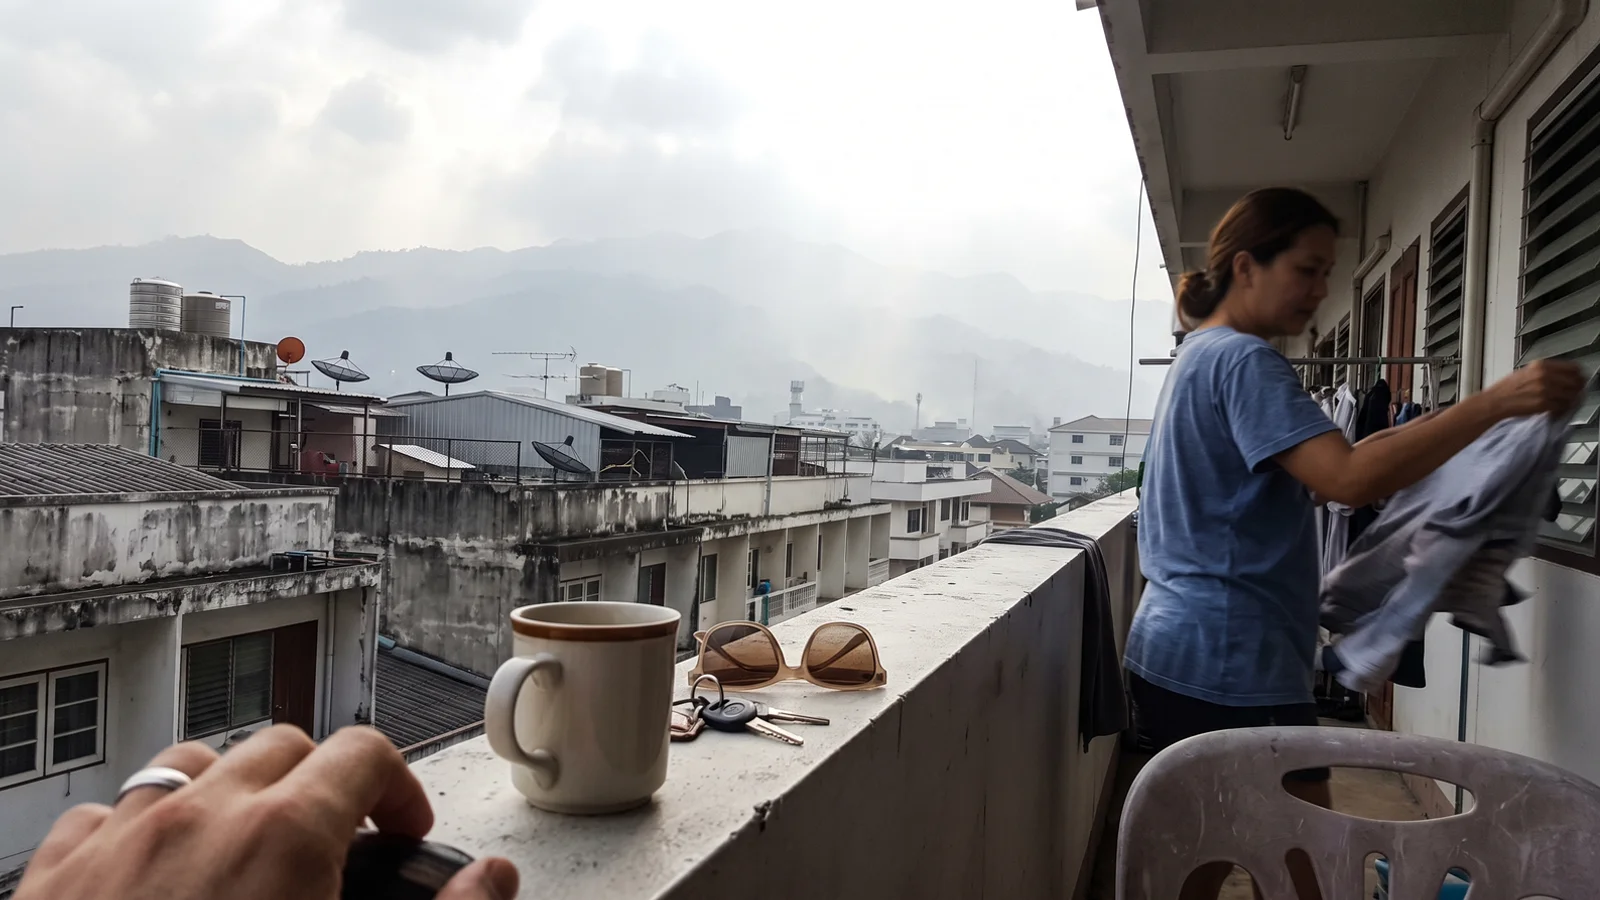
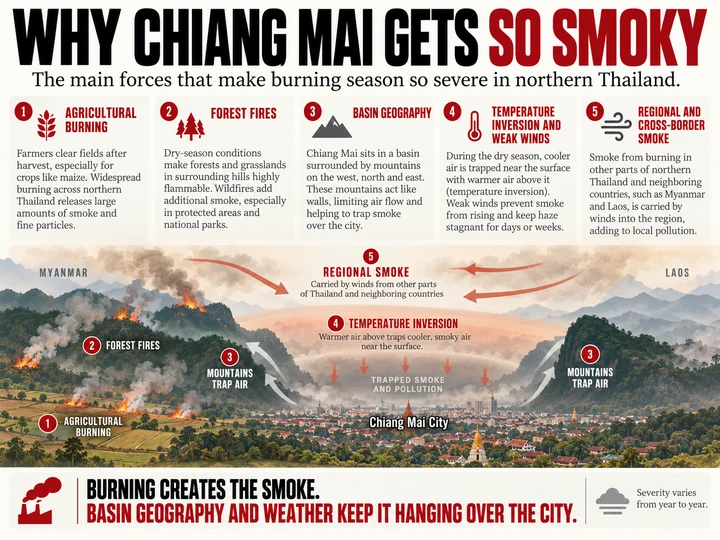
Chiang Mai’s poor air quality has a simple core explanation: every dry season, smoke is produced faster than the mountains around the city can let it leave. The bad air comes from forest fires, crop-residue burning and smoke drifting in from Myanmar and Laos — and the resulting air pollution stagnates for weeks inside a highland basin that traps the haze.
In late March 2026, Chiang Mai repeatedly topped IQAir’s live ranking of the world’s most polluted major cities — first on 26–27 March with US AQI above 220, and again on the morning of 29 March with AQI 263 and PM2.5 of 188 µg/m³. On 2 April it ranked second, at AQI 231. Yet by that May the same city was back to clean-season conditions.
Explaining that swing means following two separate ledgers. The first is emissions: what actually adds smoke and particles to the air. The second is dispersion: the basin, the inversions, the weak winds and the absent rain that decide whether that smoke can escape. This article walks through both — first what the pollution is, then where it comes from, then why it stays — during the smoke season that runs roughly January to April and peaks in March.
What’s actually in Chiang Mai’s air when it turns bad?
The pollutant that defines Chiang Mai’s haze is PM2.5: particulate matter made of particles 2.5 micrometres across or smaller. They are fine enough to penetrate deep into the lungs, and they are the main pollutant of concern in northern Thailand. Monitors also track PM10 (coarser particles), nitrogen dioxide (NO₂), sulfur dioxide (SO₂), carbon monoxide and ground-level ozone, but during the smoke season PM2.5 is what surges.
Haze-season PM2.5 in Chiang Mai is chemically distinctive. It is rich in black carbon and organic carbon — the direct soot and unburned organic material of biomass burning — and it carries a large load of secondary sulfate, particles that are not emitted directly but form in the air from precursor gases as smoke ages and drifts downwind.
What do the numbers mean — PM2.5, Thai AQI and US AQI?
Two different yardsticks appear in reporting about Chiang Mai, and confusing them causes chronic misreporting. PM2.5 is a concentration, measured in micrograms per cubic metre (µg/m³). Thailand’s national ambient standard is 37.5 µg/m³ over 24 hours (tightened from 50 µg/m³ on 1 June 2023) and 15 µg/m³ as an annual mean. The World Health Organization’s stricter 2021 guideline is just 5 µg/m³ as an annual mean.
The AQI, by contrast, is a dimensionless index — and Thailand and the United States use different scales. The Thai AQI has five bands, is computed from six pollutants on a 24-hour rolling average, and reads exactly 100 at the 37.5 µg/m³ national standard. The US AQI used by default on IQAir has six bands and crosses into “Unhealthy” at a PM2.5 concentration of roughly 55 µg/m³.
The same air can therefore read about 165 on the Thai scale and about 201 on the US scale. When a headline says Chiang Mai hit “AQI 289”, that is a US-scale index value, not a concentration in µg/m³ — a distinction much of the media collapses.
Who measures Chiang Mai’s air?
Several institutions watch the same haze from different angles:
- The Pollution Control Department (PCD) runs Thailand’s national monitoring network, publishing hourly PM2.5, PM10, ozone, NO₂, CO and SO₂ readings through its Air4Thai platform.
- The Thai Meteorological Department (TMD) supplies the weather data — rain, humidity, wind — that explains how the haze behaves.
- GISTDA, Thailand’s space agency, maps satellite-detected fire hotspots nationwide and feeds them to fire-suppression agencies.
- The ASEAN Specialised Meteorological Centre (ASMC), hosted in Singapore, issues regional transboundary-haze alerts for the Mekong sub-region.
- NASA satellites image the smoke plumes themselves, while IQAir aggregates low-cost sensors and publishes the live city rankings that generate the headlines.
Is Chiang Mai’s air quality bad all year?
No — and this is the most important nuance in the whole question. Chiang Mai’s air pollution is violently seasonal. In the most comprehensive source study of the city, an urban monitoring campaign in 2020 measured average PM2.5 of 116 ± 35 µg/m³ during the smoke-haze period against 35 ± 6 µg/m³ outside it — a more than threefold jump within the same calendar year.
A decade of Thai Meteorological Department data (2011–2020) tells the same story month by month: March averaged 80.9 µg/m³ of PM2.5, while September averaged 14.2 µg/m³. NASA’s Earth Observatory, analysing IQAir records, found that March–April levels averaged nearly 100 µg/m³ from 2017 to 2023 — roughly 20 times the WHO guideline — then fell to between 5 and 10 µg/m³ once the May rains arrived.
Annual averages sit far lower because the wet season (roughly May to October, under the southwest monsoon) is largely clean. IQAir puts Chiang Mai’s 2025 annual mean at 18.2 µg/m³ — “moderate”, though still 3.6 times the WHO annual guideline — and its 2024 mean at 26.4 µg/m³. So the question “why is Chiang Mai air quality bad” is really a narrower one: why does this city become among the worst in the world for a few months each year, and then recover?
Where does Chiang Mai’s smoke come from?
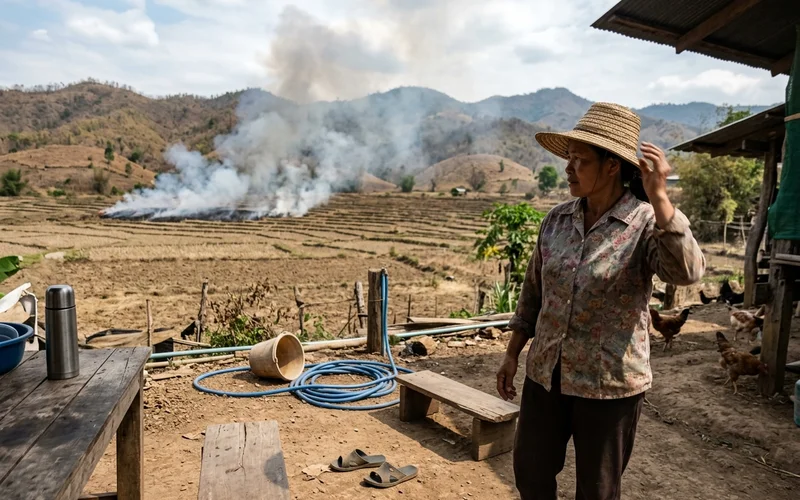
The emissions ledger has a handful of entries, and the haze is their sum. The sources that matter are:
- Forest fires — mostly deliberate surface fires in deciduous upland forest.
- Crop-residue burning — rice straw, maize stover and sugarcane trash burned after harvest.
- Transboundary smoke — haze blown in from fires in Myanmar and Laos.
- Traffic and urban sources — the year-round baseline of vehicle exhaust and dust.
- Secondary aerosol — pollution formed in the air from gases, rather than emitted as particles.
The scale of the fire emissions is extraordinary. A near-real-time satellite fire inventory (FINNv2.5) estimated that the eight northern provinces emitted more than 250,000 tonnes of biomass-burning PM2.5 in January–April 2024 alone. Chiang Mai and neighbouring Mae Hong Son together produced 51.3% of that regional total, and on the peak day, 2 April 2024, the region’s fires released an estimated 14,233 tonnes of PM2.5 in a single day.
Each of these sources has its own mechanics, and the next four sections take them in turn: the forests, the farms, the border, and the studies that try to apportion the haze between them.
Why do Chiang Mai’s forests burn every year?
The fuel is built into the landscape. Around 86% of northern Thailand’s forest is deciduous — roughly half dipterocarp forest and about 36% mixed deciduous forest — meaning most of the region’s trees shed their leaves each year. That leaf litter cures through the rainless dry season into a continuous, flammable carpet. The Forest Fire Control Division estimates that about 70% of the North’s forested area is subject to fire.
These are not crown fires racing through treetops but surface fires creeping through leaf litter — slow, smouldering combustion that is a heavy producer of fine particulate matter.
The satellite record confirms where this happens. In a 2018–2024 study of eight upper-northern provinces, Chiang Mai recorded the highest share of the region’s hotspots at 21.38%, followed by Mae Hong Son at 20.61%. In Chiang Mai province itself, GISTDA counted 4,709 hotspots between January and May 2025 — and 53.8% of them were inside protected forest areas. Most of what burns around Chiang Mai is forest, not farmland.
Who starts the fires?
Almost everyone, and almost always on purpose. Thailand’s Department of National Parks estimated in 2012 that about 88% of forest fires are caused by human activity. Surveys of protected-area staff conducted by the Forest Fire Control Division and the Department of National Parks between 2011 and 2014 paint a consistent picture of why:
| Ignition cause | Share of human-caused fires (survey range) | Survey source/year |
|---|---|---|
| Collecting forest products (mushrooms, etc.) | ~37–39% | FFCD 2011; DNP 2012/2014 |
| Hunting (flushing game) | ~11–24% | FFCD 2011; DNP 2014 |
| Clearing land / field preparation | ~11–19% | FFCD 2011 |
| Arson / conflict | ~10% | FFCD 2011 |
| Other / unspecified | remainder | — |
Surveys of protected-area staff; ranges reflect different survey years. About 88% of all ignitions are human-caused (DNP 2012).
The logic behind the largest category is economic, not careless. Burning clears the leaf litter so that prized wild mushrooms flush after the first rains, opens the forest floor for hunting, and clears ground for slash-and-burn agriculture. Fire is deeply embedded in the upland economy and culture — researchers describe it being used to manage fuel loads, to earn income, and occasionally even as a form of protest. Calling these events “wildfires” in the accidental, out-of-control sense misses the point: most are set deliberately, for reasons that make sense to the people setting them.
How much does crop burning contribute?
Northern Thailand’s fields produce three dominant burned residue streams: rice straw, maize stover and sugarcane trash. Burning is concentrated in the late dry season, typically peaking from late February through March — exactly when the haze is at its worst.
The maize belt is the sharpest driver. A Greenpeace Southeast Asia satellite analysis mapped 583,459 hectares of maize plantations in upper northern Thailand and another 1,203,928 hectares across the border in Myanmar’s Shan State. In Chiang Mai’s Mae Chaem district alone, about 170,000 rai is planted in corn, generating roughly 90,000 tonnes of waste a year — about half of which is burned in the open. The boom is driven by animal-feed demand under contract farming: maize became the region’s cash crop largely through CP Group’s contract-farming system, which since 2017 has run a corn-traceability scheme under the purchasing principle “no forest encroachment, no crop burning, we buy.”
Is “farmers burning crops” the whole story?
No — and the numbers here surprise most people. By area, what burns inside Chiang Mai province is overwhelmingly forest: a Chiang Mai University study estimated that 91–98% of burned area in 2015–2016 was forest, versus 2–9% agricultural land. Syntheses of satellite hotspot classifications put forest at roughly 70–80% of hotspots in the upper north, against 5–22% for agriculture.
Crop residue matters more elsewhere and earlier. In a six-province study of crop-burning emissions, lower-northern Nakhon Sawan contributed about 41% while Chiang Mai contributed just 9.4% — rice and sugarcane burning concentrate in the lower north’s lowlands, not around Chiang Mai. And isotope fingerprinting of Chiang Mai city haze found that C4 plants — in practice, maize — supplied about 26% of the biomass-burning signal (C3 plants such as forest vegetation supplied about 74%), with the maize signal strongest in January–February, early in the season.
Sugarcane plays a supporting role nationally: burned cane made up 21.8% of the 2024/25 harvest, and the government claims burnt cane’s share of PM2.5 haze has fallen from a historical 70% to 30–35% — a political claim without published methodology.
How much of the haze blows in from Myanmar and Laos?
A great deal — and the satellite record shows the asymmetry plainly. On 26 March 2023 — Thailand’s highest daily count in five years — Myanmar recorded 10,563 hotspots and Laos 9,652, against Thailand’s 5,572. The pattern repeated in 2026: on 25–26 March, satellite surveillance reported by ASMC counted 2,806 and 3,139 hotspots “particularly in Myanmar and Lao PDR”, triggering the regional centre’s highest alert level on 27 March.
Wind does the delivery. During the February–April peak, prevailing southwesterly to westerly winds advect smoke plumes from eastern Myanmar and northern Laos straight into the upper northern provinces, especially Mae Hong Son and Chiang Mai.
Modelling studies put numbers on the import share. A 2025 GeoHealth attribution study found external sources — foreign burning plus boundary inflow — accounted for 57% of mainland Thailand’s modelled PM2.5 in March and 76% in April. And a CMAQ-ISAM country-tagging model showed Myanmar’s fires are the major contributor to PM2.5 in western and central upper-north Thailand, including Chiang Mai, during the March–April peak. Thai authorities see it too: during an early-May 2024 episode, the PCD counted 1,480 forest, 409 cornfield and 331 rice-field hotspots inside Thailand — against 4,791 hotspots in Laos and 1,243 in Myanmar.
So who’s to blame for the regional haze?
Both sides of the border, in sequence. Chemical-transport modelling (WRF-Chem) evaluated at ten PCD monitoring stations found that on days classified Unhealthy or worse, transboundary PM2.5 contributed at least 50% of the total at every station. The Thai government’s own working estimate is that 30–40% of PM2.5 comes from across the border. At the same time, hotspot data show Thai fires surging on the very worst days — a local layer of smoke piled on top of an imported regional background.
The honest reconciliation is that the two camps measure different things: burned-area maps count what burns inside Thailand, while receptor models apportion the smoke actually breathed in the city, which includes the imported background. Both agree that biomass burning — wherever it originates — makes up roughly 50–80% of haze-season PM2.5. And none of this is unique to Chiang Mai: the same fires, inversions and basin geometry drive the haze right across the upper north, from Mae Hong Son through Lamphun to Chiang Rai.
What do source studies say — and why do their numbers differ?
Ask a dozen studies how much of Chiang Mai’s haze comes from burning, and you will get answers from about half to about four-fifths. That spread is not sloppiness; it reflects four genuinely different ways of measuring the problem. Each method sees a different slice of reality.
Receptor studies (measuring the smoke at the monitor)
Receptor models chemically analyse particles collected at a monitor and work backwards to their sources. The most comprehensive Chiang Mai study (PMF receptor model, full chemical speciation, urban Chiang Mai, 2020) apportioned haze-season PM2.5 as 51% biomass burning, 23% secondary sulfate, 14% dust and 13% traffic — absolute contributions of 59.3, 26.2, 16.1 and 14.6 µg/m³ out of a 116 µg/m³ mean. A basin-wide PMF study (2018–2019) found 57.9% biomass burning during haze episodes. A rural molecular-marker study (2019) split biomass burning into mixed, local and aged components summing to about 63% of haze-period PM2.5.
Emission inventories (counting what is burned)
Inventories work from the other end: they total up fuel burned and activity data across the country. Thailand’s national 2019 inventory attributes national PM2.5 emissions to agriculture (29%), residential and commercial combustion (23%) and forest fires (16%). Note what this is: an annual, national count of emissions — not a measurement of the haze-season air over one city. Secondary aerosol, which forms from gases after emission, is invisible to it entirely.
Transport models (simulating where smoke travels)
Chemical transport models simulate emissions moving through weather. A WRF-CMAQ simulation of 2019 found biomass burning contributed 49.1% of Chiang Mai’s annual-average PM2.5, rising to 70.7% in April. The GeoHealth 2025 study above, modelling mainland Thailand, put external sources at 57–76% of modelled PM2.5 in the peak months — a different question (origin, not source type) yielding a different-looking number.
Chemical fingerprints (carbon isotopes)
Radiocarbon analysis measures the carbon fraction of particles, not their total mass. A ¹⁴C study of February–April 2018 found biomass burning supplied 65.5% of total carbon at an urban Chiang Mai site and 79.9% at a rural one — shares of the carbon, not of PM2.5 mass, which is why they read higher than the PMF results. Stable-isotope work separately confirmed the burning mix: about 74% C3 plants and 26% C4 plants of the biomass-burning signal.
The synthesis matters more than any single figure. These studies sampled different years, sites, seasons and chemical species; their percentages are not measuring the same thing and cannot be averaged into one headline number. Method choice alone can move the answer dramatically: one metals-only PMF study resolved biomass burning at 79% of PM2.5, but it used potassium as its sole burning tracer and had no sulfur inputs — so it never resolved secondary sulfate at all, and later researchers argue it likely overestimated burning’s share. What the literature agrees on is the shape of the answer: biomass burning dominates the haze season (roughly half to four-fifths depending on method), while traffic dominates the clean season.
What about traffic and city pollution?
Chiang Mai is a real city with a real traffic problem. The province had about 1.8 million registered vehicles as of 2015 — including roughly 1.2 million motorbikes — for a population of about 1.7 million. So why doesn’t the haze come from tailpipes?
Because the haze and the baseline are two different pollution problems. The urban receptor study above found traffic contributed about 76% of non-haze-season PM2.5 at its city site — but only about 13% during the haze, when smoke overwhelmed everything else. A basin study corroborates the flip: vehicle exhaust rose from 7.8% of PM2.5 during haze episodes to 18.3% in the rainy season. Traffic is the main year-round cause of Chiang Mai’s ordinary, chronic air pollution; it is a minority shareholder in the spring smoke crisis.
Heavy industry barely figures locally. Chiang Mai province has no Category-3 large-scale factories, according to Department of Industrial Works data. The nearest major point source is the Mae Moh lignite power plant in Lampang province — Thailand’s largest at 2,455 MW — which caused sulfur dioxide crises in 1992 and 1998, has seen retirement delays as recently as 2025, and is slated for a full coal phase-out by 2050. How much of its sulfate reaches Chiang Mai is unclear — trajectory analysis in the urban receptor study linked the haze’s secondary sulfate to source areas toward the Indian continent — but either way the plant is not in the city and cannot explain the seasonality.
Is Chiang Mai’s pollution like Bangkok’s?
No — they are structurally different problems. Estimates of traffic’s share in Bangkok range from about 25% of ambient pollution (IQAir) to more than 65% in congested districts and 73% of local PM2.5 emissions in an emissions inventory — figures that measure different things and are not directly comparable. Either way, Bangkok’s problem is dominated by vehicles and persists year-round, while Chiang Mai’s crisis is dominated by smoke and arrives seasonally.
The annual means reflect the difference in shape: Chiang Mai’s 2024 average of 26.4 µg/m³ (IQAir) runs above Bangkok’s recent annual averages, inflated by a few extreme months rather than a uniformly elevated year.
Does Chiang Mai’s geography make the air bad?
Here is the second ledger — and one point must be stated plainly: the mountains do not make the smoke. Geography creates no PM2.5 whatsoever. It only decides whether the smoke that arrives can leave. In Chiang Mai’s case, it mostly cannot.
The city district, Mueang Chiang Mai, sits at roughly 300–310 metres elevation in the Mae Ping river basin — the Chiang Mai–Lamphun Basin — ringed by high ranges on multiple sides. To the west, the Thanon Thong Chai range rises to Doi Inthanon at 2,565 metres (Thailand’s highest peak), with Doi Pui at 1,685 metres and Doi Suthep at 1,676 metres looming directly over the city. The Khun Tan range closes the east, and the Daen Lao range bounds the province to the north.
NASA’s Earth Observatory describes the city as lying “within a network of narrow valleys” in the northern highlands, in “a basin prone to temperature inversions that can prevent winds from dispersing air pollution”. The basin is, in effect, a bowl with the lid half on — and it is the lid that the next section explains.
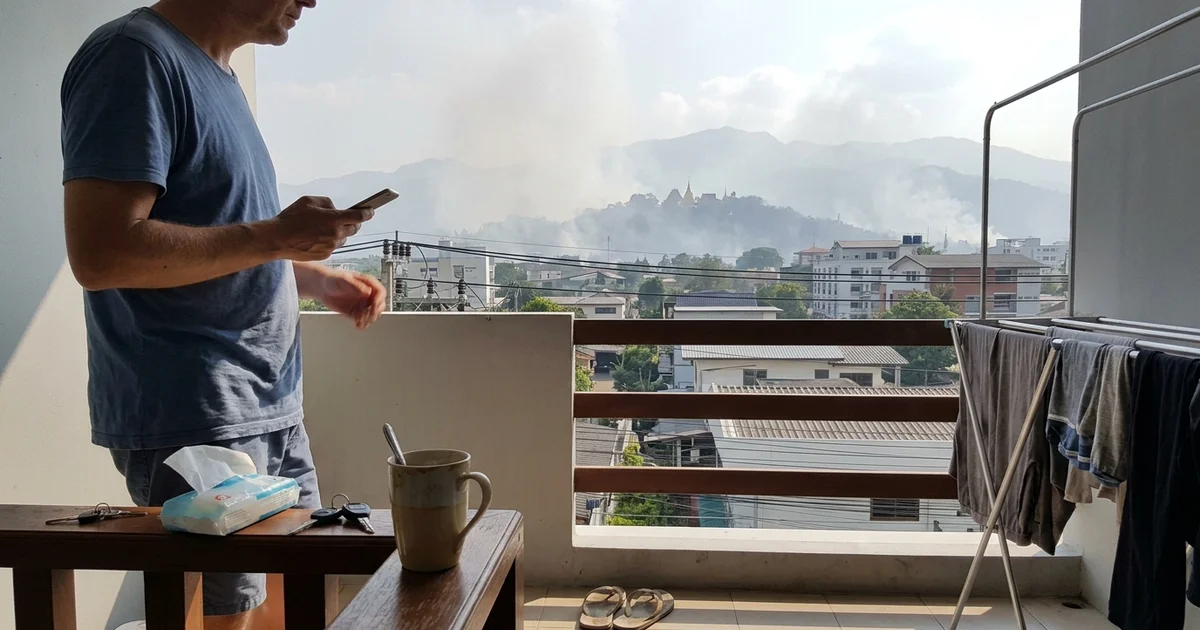
Why does the smoke get trapped?
The lid is a temperature inversion: a layer of warmer air sitting above cooler air near the ground. Because warm air over cool air is stable, it acts as a cap — smoke emitted at the surface cannot rise through it, so pollution accumulates in a shallow layer pressed against the city.
In Chiang Mai, inversions occur seasonally from November to March — exactly the smoke season. Radiosonde measurements during haze episodes found inversion layers running from ground level up to 606 metres on 21 March 2018, and from the ground to 476–658 metres during 12–25 March 2019. At night the mixing layer — the depth of air in which pollutants can spread — collapses to about 50–100 metres, versus a couple of thousand metres by day.
March is the trap’s tightest month. Lidar measurements in the Chiang Mai valley found March had the weakest daytime mixing-layer growth and the lowest ventilation coefficient of the year, producing “the strongest confinement of pollutants within the valley”. During the 28–30 March 2018 episode, the boundary layer collapsed to roughly 50 metres while weak west-to-southwest winds of 1 to under 4 m/s failed to flush it. There is even a feedback loop: NASA’s ASIA-AQ campaign describes how intense aerosol pollution scatters and absorbs sunlight, suppressing boundary-layer growth, which in turn traps more pollution near the surface.
Why is the haze worst in the early morning?
Because the lid is lowest then. Overnight, the boundary layer shrinks to its shallowest, concentrating the same smoke into a fraction of the air volume. A March 2024 sensor network across the basin measured PM2.5 peaking around 9 AM at roughly 101 µg/m³, falling to about 62 µg/m³ by 5 PM as daytime heating lifted the layer and let pollutants mix upward.
NASA’s research flights over Chiang Mai found a further twist: pollutant layers accumulating at 1,500–3,000 metres altitude, sandwiched between inversion layers and weak upper winds, forming recirculation zones. In plain terms, smoke that does escape the surface layer can be folded back down into it — the basin recycles its own haze.
What role do wind and weather play?
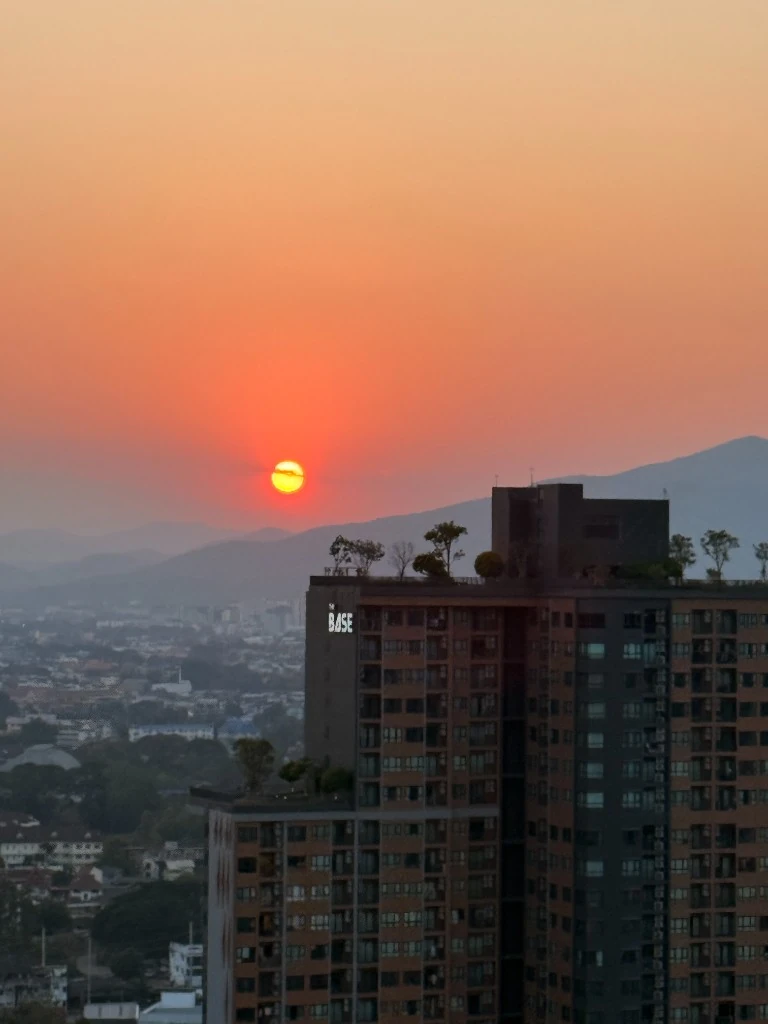
Wind is the basin’s only broom, and during haze episodes it barely sweeps. Measured wind speeds within episodes range between 0 and 2 m/s. In a 2020 case study, the calmest spell of the observation period — average winds dropping to 16.67 km/h on 28–29 March — aligned precisely with the peak pollution window of 28 March to 10 April. Stagnation, not just emissions, marks the worst days.
Rain is the reset button, and the dry season withholds it. Chiang Mai averaged just 7.8 mm of rain in February and 13.5 mm in March across 2011–2020, against 220.9 mm in August; measured haze periods ran at 56.6% relative humidity against 73.5% in non-haze periods. Multi-week rainless stretches are routine mid-season — Chiang Mai recorded no rain at all from 28 March to 24 April 2020.
When rain does arrive, the effect is immediate. A seasonal thunderstorm in March 2024 dropped basin PM2.5 from 181 µg/m³ on 16 March to about 30 µg/m³ by 20 March. And when the monsoon returns in May, the season breaks entirely: PM2.5 falls from the March–April average of nearly 100 µg/m³ to between 5 and 10 µg/m³. The haze ends not when the fires are extinguished, but when the weather changes.
When the weather refuses to cooperate, the state tries to change it. In early April 2026 the Department of Royal Rainmaking and Agricultural Aviation flew cloud-seeding and cold-water-spraying sorties over Chiang Mai — dry-ice seeding aimed in part at breaking the inversion layers themselves. It is an emergency response aimed at the dispersion side of the ledger; it does nothing about the smoke being emitted.
Why is it worse some years than others?
The master variable is ENSO — the El Niño–Southern Oscillation, the Pacific climate cycle that alternately dries and wets Southeast Asia. El Niño years bring hotter, drier conditions to the region: more flammable forest, more fire, and more stagnant accumulation. La Niña years bring more rain and humidity, suppressing both burning and build-up.
The cleanest evidence is a peer-reviewed series of February–April PM2.5 means measured at a Chiang Mai monitoring station, tagged by ENSO phase (Yabueng et al., 2020):
| Year | ENSO phase | Feb–Apr mean PM2.5 (µg/m³) | Regional hotspots |
|---|---|---|---|
| 2015 | El Niño | 78.9 | — |
| 2016 | El Niño | 70.0 | — |
| 2017 | La Niña | 44.2 | 7,823 |
| 2018 | La Niña | 56.9 | 6,214 |
| 2019 | El Niño | 65.9 | 14,736 |
| 2020 | El Niño | 65.8 | 18,816 |
Source: Yabueng et al. 2020 (PCD station data, VIIRS regional hotspots); dashes mark cells not reported for that year.
The pattern is stark: the four El Niño-tagged years all exceed 65 µg/m³, while the two La Niña years sit at 44.2 and 56.9 µg/m³. A separate Chiang Mai study found the same contrast in source terms — biomass burning’s share of haze PM2.5 was 79% in the El Niño year 2019 against 50% in the La Niña year 2017 (a metals-only PMF result, subject to the method caveat described above).
Is Chiang Mai’s air getting worse?
The evidence is mixed, and honesty requires saying so. Severe recent seasons are real: 2023 brought the 29 March episode when Chiang Mai led the world’s live rankings, and 2026 brought a sharp escalation in burning — 133,548 hotspots detected across Thailand between 1 January and 19 April 2026, up from 89,520 in the same period of 2025, an increase of nearly 50%.
But annual means bounce rather than trend. IQAir’s 2025 city average of 18.2 µg/m³ was the lowest in its recent series, and a separate Thai government (DCCE) monitoring series — a different dataset from IQAir’s — recorded Chiang Mai province at 19.3 µg/m³ in 2022, rebounding to 32.8 in 2023 and easing to 27.6 in 2024. The mild 2022 season itself is an open scientific question: it coincided with both a wet La Niña year and tightened burn enforcement, and no study has cleanly separated the two. The fairest verdict is no clear long-term trend — but very high year-to-year variance, driven by the climate cycle on top of whatever policy achieves.
Is Chiang Mai really the world’s most polluted city?
Episodically, yes — and the claim needs careful framing. IQAir’s live ranking is timestamp-specific: it ranks cities by their readings at that moment. On that basis, Chiang Mai legitimately topped the world in late March 2026 (US AQI above 220 on 26–27 March, then AQI 263 with PM2.5 of 188 µg/m³ on the morning of 29 March), and ranked second on 2 April at AQI 231. The 2023 season was similar: on 29 March 2023, IQAir showed US AQI 289 and PM2.5 of 239 µg/m³, putting Chiang Mai first ahead of Lahore and New Delhi for weeks — while a provincial monitor in Chiang Dao district recorded 960 µg/m³ that week.
Annually, no. Chiang Mai’s 2025 average was 18.2 µg/m³ — “moderate” on the US scale, 3.6 times the WHO annual guideline — and its 2024 average was 26.4 µg/m³. A city that ranks first in the world on a March morning can rank unremarkably across the year, because the ranking is a snapshot of a city whose bad air is compressed into a few months. That volatility is itself diagnostic: only a city whose pollution swings violently between seasons can occupy both positions.
The annual framing still carries a real cost. The Air Quality Life Index estimates that particulate pollution shortens the average northern Thai resident’s life by about 2.7 years against the WHO guideline, with Chiang Rai and Phayao worst at over 3.5 years; among Thailand’s most populous provinces, Chiang Mai shows the largest potential gain if the guideline were met.
What is being done — and why do the causes persist?
Thailand has not been idle. The policy record is long, and its structure explains a great deal about why the haze persists:
- Zero-burning (2013; strictly enforced since 2016): a ban on open burning across the nine upper-northern provinces for about 60 days each February–April. It cut dry-season fire hotspots by 50–80% in 2017–2018 against the prior decade’s average — but compressed rather than eliminated burning, stretching the haze period from about two months to about three as people burned before and after the window.
- The FireD app (2021): Chiang Mai shifted to a permission-based system in which farmers register “unavoidable” burns. Researchers estimate up to half the province’s fires are never registered.
- The 2026 escalation: Chiang Mai province banned all open burning from 1 February to 31 May 2026, with farmers caught burning losing eligibility for government agricultural support from 1 April 2026 to 31 March 2028. Nationally, a target to cut burned farmland by at least 15% was announced on 9 January 2026, and imports of agricultural products linked to open burning have been banned since 1 January 2026 — a measure the government claims cut corn imports by 70%.
- Emergency powers: disaster-zone declarations followed in Chiang Mai, Lamphun and Phayao in early April 2026, and Chiang Mai, Chiang Rai, Lamphun and Mae Hong Son were designated pollution control zones in 2025.
- Regional diplomacy: Thailand, Laos and Myanmar launched the CLEAR Sky Strategy 2024–2030 in Bangkok on 29 October 2024, a joint plan explicitly targeting forest fires and agricultural burning as cross-border PM2.5 sources.
- Legal pressure: in January 2024 the Chiang Mai Administrative Court ruled the prime minister and National Environment Board negligent over the 2023 haze; in September 2024 the Supreme Administrative Court ordered an action plan. A comprehensive Clean Air Bill, meanwhile, has stalled amid organised resistance from business groups led by the JSCCIB.
Why hasn’t it worked?
Because the causes sit mostly outside the reach of the instruments. A large share of the smoke originates in Myanmar and Laos, beyond Thai jurisdiction, and the regional mechanism to address that was launched only in late 2024. Domestically, fire is embedded in the upland economy — mushrooms, hunting, debt-driven maize farming — so bans displace burning in time rather than eliminate it.
Enforcement of a roughly 60-day window against millions of rai of forest and farmland exceeds the state’s field capacity, and the permit system leaks: half of fires go unregistered. Policy has shaved the peaks; it has not yet broken the emission side of the ledger.
The bottom line: why is Chiang Mai air quality bad?
The answer comes in two ledgers. On the emission side, the region burns: deliberate forest fires in deciduous upland forest, crop-residue burning led by feed maize, smoke blown in from Myanmar and Laos, and a year-round traffic baseline in the city itself. On the dispersion side, the geography fails to clear it: a mountain-walled basin, seasonal temperature inversions, a night-time boundary layer that collapses to tens of metres, near-calm winds and virtually no rain between February and April. Smoke is produced faster than the basin can ventilate it — that, in one sentence, is why Chiang Mai air quality is bad.
How bad any given year gets depends on the climate cycle: El Niño years burn hotter and drier, La Niña years wash cleaner, and annual averages bounce accordingly. Policy has multiplied over the past decade without yet breaking the burning economy or reaching across the border — which is why the haze keeps returning.
For month-by-month context at the peak of the haze, see Chiang Mai air quality in March.
Sources
Peer-reviewed studies
- Chansuebsri et al. (2024), Chemical composition and origins of PM2.5 in Chiang Mai by integrated source apportionment, Atmospheric Environment
- Ponsawansong et al. (2023), Sources of PM2.5 Oxidative Potential during Haze and Non-haze Seasons in Chiang Mai, AAQR
- Saksakulkrai et al. (2025), molecular-marker PMF at a rural northern Thailand site, Journal of Environmental Sciences
- Song et al. (2022), radiocarbon source apportionment, urban vs rural Chiang Mai, Environment International
- Kawichai et al. (2022), Source Identification of PM2.5 during a Smoke Haze Period in Chiang Mai Using Stable Carbon and Nitrogen Isotopes, Atmosphere
- Kawichai et al. (2021), burned-area estimates for Chiang Mai province, CMU Natural and Life Sciences Communications
- Chantaraprachoom et al. (2023), WRF-CMAQ biomass-burning on/off assessment for 2019, E3S Web of Conferences
- Chantaraprachoom et al. (2024), nation-by-nation CMAQ-ISAM attribution, Atmosphere
- Inlaung et al. (2024), Assessment of Transboundary PM2.5 from Biomass Burning in Northern Thailand Using WRF-Chem, Toxics
- Thongsame et al. (2025), Source Attribution and Health Burden of PM2.5 in Mainland Thailand, GeoHealth
- Thailand national emission inventory (EI-TH 2019), Environments
- Chotamonsak et al. (2026), FINNv2.5 near-real-time fire-emission inventory, Toxics
- Solanki et al. (2019), Mixing Layer Height Retrievals in the Chiang Mai Valley, Frontiers in Earth Science
- Sresawasd et al. (2021), meteorology and hotspots in strong haze episodes, AAQR
- Samphutthanont et al. (2025), Tracking the Dynamics of Air Pollution in Northern Thailand, International Journal of Geoinformatics
- Yabueng et al. (2020), zero-burning policy and ENSO influence on PM2.5, Atmospheric Environment
- Kraisitnitikul et al. (2024), contrasting PM2.5 composition in La Niña vs El Niño years, Journal of Environmental Sciences
- Air pollution-related respiratory diseases and environmental factors in Chiang Mai, 2011–2020 (monthly climate/PM2.5 table)
- Zero-Burning Strategies for PM2.5 and GHG Mitigation: crop residue burning in Northern Thailand, Land (2026)
- Chiang Mai 2025 hotspot land-type analysis (GISTDA data), Fire
- Archer et al. (2024), particulate matter pollution in central Bangkok (emissions inventory)
- Damage-Intensity Prioritisation of Agricultural-Residue Burning in Northern Thailand, Sustainability (2026)
- Estimation of Black Carbon Emissions from Dry Dipterocarp Forest Fires in Thailand, Atmosphere
- Thailand’s tightened PM2.5 ambient standards (37.5 µg/m³ 24-h; 15 µg/m³ annual), Environments
- Pirard & Charoenpanwutikul, Comprehensive review of the annual haze episode in Northern Thailand (preprint review; forest composition, ignition surveys, inversion climatology)
Official agencies & monitors
- ASMC (ASEAN Specialised Meteorological Centre), regional haze alert record
- NASA Earth Observatory, Hazy Skies in a Growing City
- NASA ESPO, ASIA-AQ Rapid Science Synthesis Report (Thailand)
- Thai Ministry of Foreign Affairs, CLEAR Sky Strategy launch remarks (29 October 2024)
- Thai Government PRD, 2026 burned-farmland reduction target and penalties
- Thai Government PRD, 26 March 2023 cross-border hotspot counts
- Thai Government PRD, Department of Royal Rainmaking aircraft deployment over Chiang Mai (April 2026)
News & datasets
- IQAir newsroom, Chiang Mai tops live pollution ranking, 27 March 2026 (also 2025/2024 annual means)
- Open Magazine, Chiang Mai’s 29 March 2026 episode (AQI 263, PM2.5 188 µg/m³)
- The Nation, Chiang Mai second-worst worldwide on 2 April 2026
- Bangkok Post, Chiang Mai’s 29 March 2023 episode (US AQI 289, PM2.5 239 µg/m³; Chiang Dao 960 µg/m³)
- Xinhua, Thailand’s 5,572 hotspots on 26 March 2023, a five-year high
- AP News, the culture and economics of fire in northern Thailand; FireD registration gaps
- Chiang Mai Citylife CityNews, Chiang Mai’s 1 February–31 May 2026 open-burning ban and penalties
- Bangkok Tribune, PM and National Environment Board found negligent (January 2024)
- The Nation, government cross-border PM2.5 estimate and corn-import measures (April 2026)
- Thai Enquirer, Thailand’s 133,548 hotspots in early 2026 vs 89,520 in 2025
- Bangkok Tribune, burned-cane share of the 2024/25 harvest and government haze-share claim
- Kasikorn Research, traffic’s share of PM2.5 in congested Bangkok districts
- Climate Connectors, the stalled Clean Air Bill and business resistance
- Greenpeace Southeast Asia, Maize, Land Use Change and Transboundary Haze Pollution
- Chiang Mai Citylife, province vehicle stock (2015)
- Bangkok Tribune, May 2024 upper-North episode (NASA basin-inversion quote; PCD hotspot snapshot)
- Thairath English, Chiang Mai 2026 hotspot record and disaster-zone declarations
- Thairath English, 2026 burning ban and 2025 pollution-control-zone designations
- IQAir 2024 World Air Quality Report (vehicle share of Bangkok’s air pollution)
- Air Quality Life Index (AQLI), Thailand Fact Sheet 2025
- University of Wisconsin–Madison thesis citing Department of Industrial Works factory data for Chiang Mai province
- University of Southampton thesis citing Department of National Parks (2012) ignition-cause data
- The Access Initiative, Mae Moh lignite plant SO₂ history
- Global Energy Monitor, Mae Moh power station (retirement delays, phase-out timeline)
- Wikipedia, Chiang Mai (basin elevation and surrounding ranges)
- Wikipedia, Thanon Thong Chai Range (summit elevations)
Stay updated
Get the Chiang Mai Brief
Useful local updates, new guides, openings and practical information for living in or visiting Chiang Mai.