Chiang Mai Air Quality by Month: Cleanest & Worst Months
Chiang Mai Air Quality in March: What to Expect, Week by Week and Year by Year
Chiang Mai air quality in March is usually the worst of the year. Historical PM2.5 and AQI data, severe vs mild years, and how to decide whether to visit.
12 min read
By Daniel Calleja, founder of The Chiang Mai Brief and Chiang Mai resident.
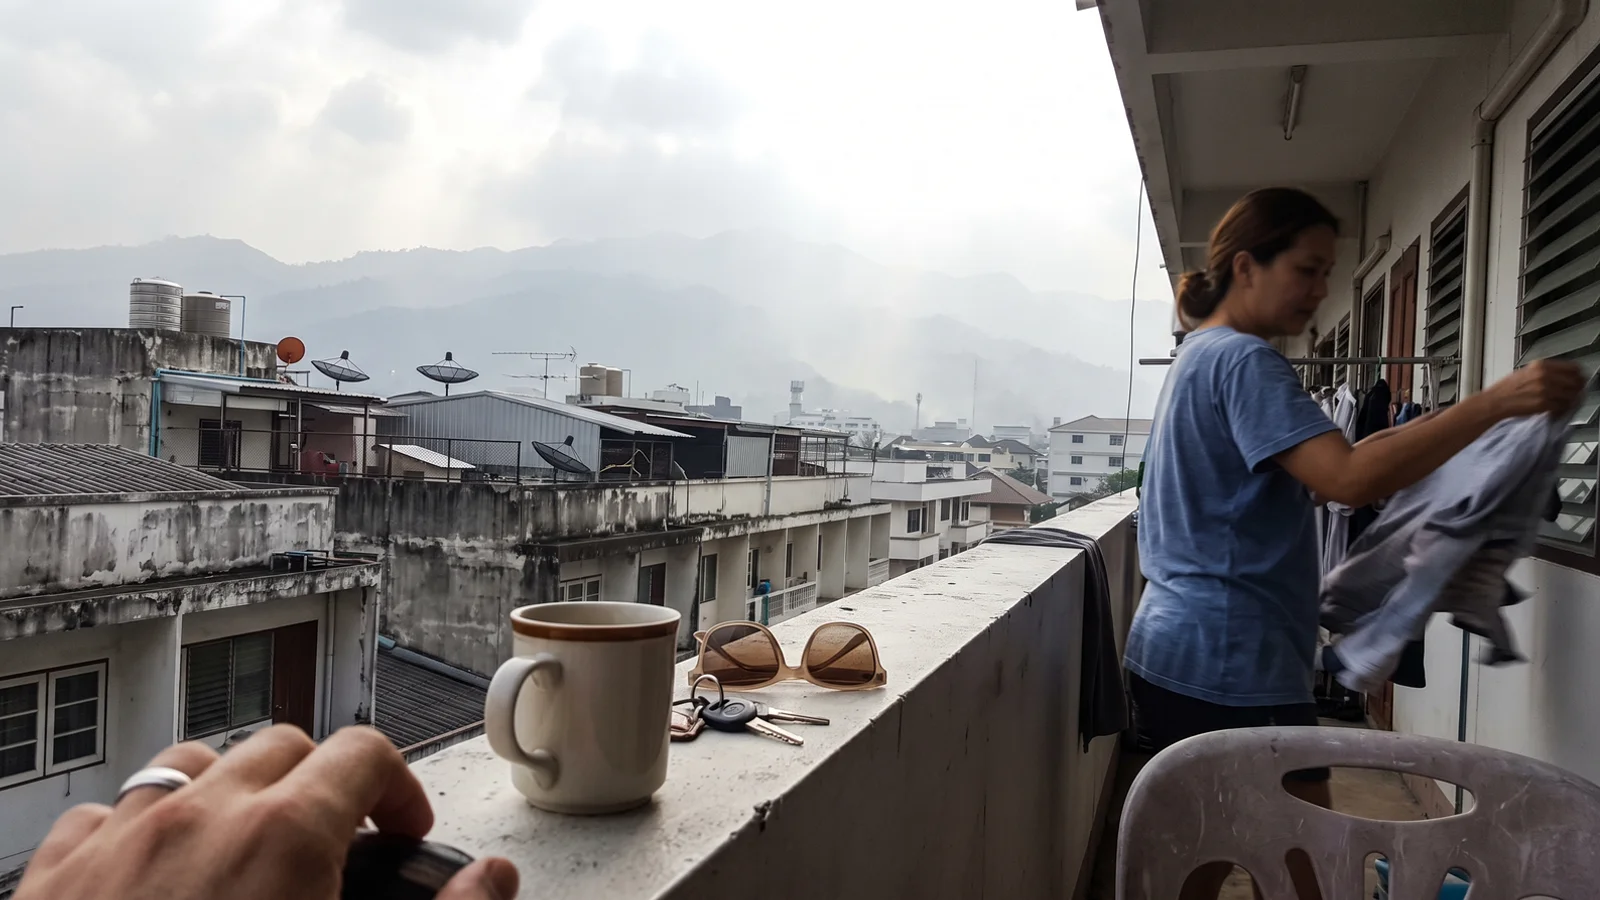
March is typically Chiang Mai’s worst month for air quality: it had the highest monthly-average PM2.5 of any month in five of the last seven verified years. The haze peaks when crop burning, forest fires and cross-border smoke hit their annual maximum in the driest, stillest month of the northern Thailand dry season, inside a basin that traps pollution for weeks. But severity swings enormously by year and week — March 2026 held both an unusually clean 13-day stretch and days when Chiang Mai topped the live world pollution ranking. The useful answer is not “avoid March” but: know the numbers and check the air quality report daily.
What Is Chiang Mai’s Air Quality Like in March?
A typical March is hazy, dry and smoky. A peer-reviewed 2011–2020 climatology of Thai Pollution Control Department (PCD) and Thai Meteorological Department (TMD) stations puts the March mean PM2.5 at 80.9 µg/m³ (monthly average) — above April’s 57.6 and February’s 49.5, and over five times the WHO 24-hour guideline. March is the driest month (~13.5 mm of rain vs ~45 mm in April), and TMD normals record haze on roughly 27 March days (a visibility measure, not a PM2.5 count).
Peer-reviewed studies attribute roughly half to two-thirds of haze-season PM2.5 to biomass burning — a mix of crop-residue burning (maize, rice and sugarcane), forest fires and transboundary smoke from Myanmar, with the exact split varying by year and study; traffic contributes only about 8–15%. Chiang Mai sits in the Ping River basin, ringed by ranges, where weak winds and overnight temperature inversions hold polluted air near the ground — mornings are the worst part of a March day, and only wind or rain, not the calendar, clears the air. For the research evidence on why Chiang Mai air quality is bad — how smoke, weather and geography combine — see our dedicated guide.
March sits at the peak of Chiang Mai air quality and burning season patterns, when fire activity, driest weather and strongest inversions coincide.
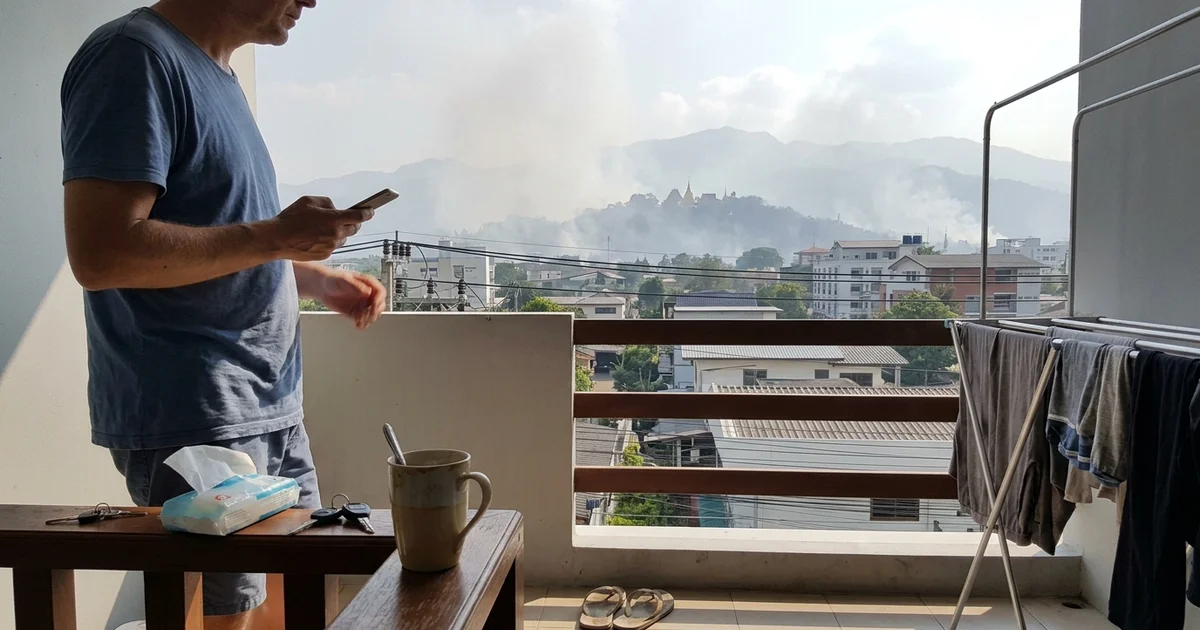
What’s the Difference Between PM2.5 and AQI in the March Numbers?
Every March statistic is one of two different things, and mixing them causes most of the confusion:
- PM2.5 is a measured concentration of fine particulate matter, in micrograms per cubic meter (µg/m³). Thailand’s 24-hour standard is 37.5 µg/m³ (in force since June 2023); the WHO 2021 guideline is 15 µg/m³ over 24 hours and 5 µg/m³ annually.
- AQI (air quality index) is a score converted from pollutant concentrations. The US EPA scale and Thailand’s PCD scale are different systems — the same air scores differently on each. Most international apps (IQAir, AQICN) show US AQI; the official Thai app (Air4Thai) shows the Thai AQI.
Averaging windows matter as much. A real-time AQI reflects recent hours and can spike far above the daily average; a monthly average smooths out both. Every figure below is labeled by metric, window and scale. (Methodology note: the US EPA revised its PM2.5 AQI breakpoints in May 2024, so pre- and post-2024 values use different conversion tables.)
How Bad Can Chiang Mai’s Air Get in March?
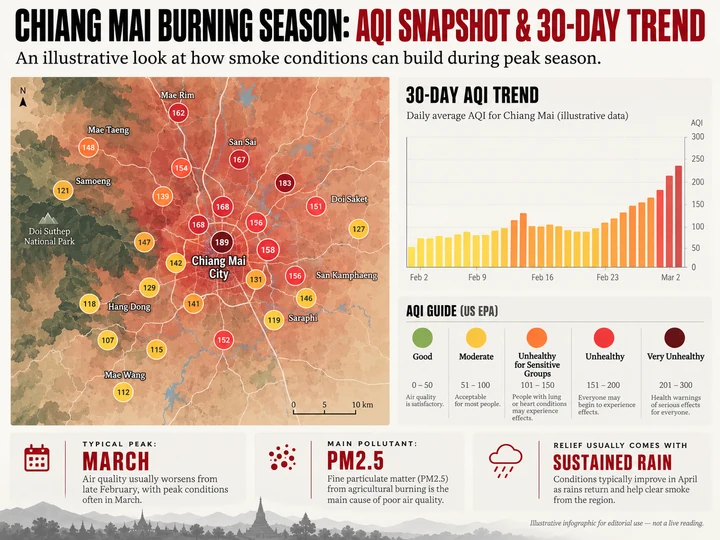
At its worst, March briefly makes Chiang Mai the world’s most polluted major city — real-time, among the roughly 100–140 monitored major cities, at that moment:
- 29 March 2023, 10:30 a.m.: real-time US AQI 289, real-time PM2.5 of 239 µg/m³ — world #1 on IQAir’s live ranking.
- 30 March 2026, ~10:00 a.m. (Monday): real-time US AQI about 233–263 (Bangkok Post recorded 263; The Nation 233 — same live ranking, different snapshot minutes), real-time PM2.5 of 188.0 µg/m³. World #1 for 4+ consecutive days into April 1.
- 14 March 2019: Thai PCD AQI 309 — the Thai scale, not US AQI — with flights between Chiang Mai and Mae Hong Son disrupted.
District readings outside the city go higher: on 28 March 2023, short-period readings in Chiang Dao district, about 70 km away, reportedly reached 960 µg/m³; on 30 March 2026 the district 24-hour maximum was 255.1 µg/m³ at Muang Na, Chiang Dao. These are rural extremes near active fires, not city values.
Why Does the Same March Day Show Three Different Numbers?
Take 30 March 2026: real-time US AQI peaked at roughly 233–263 (IQAir live feed), daily-average AQI on AQI.in was 208 (a full-day average dilutes the peaks), and real-time PM2.5 hit 188.0 µg/m³ — a different metric entirely. All three are true at once; they answer different questions — always match averaging window and scale before comparing sources.
Is March Usually Chiang Mai’s Worst Month for Air Quality?
Usually, yes — but not always. By IQAir’s monthly-average PM2.5 data, March was Chiang Mai’s worst month in five of the last seven verified years (2019, 2020, 2021, 2022 and 2025). The exceptions are recent: April beat March in 2023 (104.2 vs 97.8 µg/m³) and 2024 (76.8 vs 71.6), and in 2026 the season’s worst days straddled late March and early April.
The worst stretch typically runs from mid-March into early-to-mid April, with March at its center. For how March compares with the other eleven months, see Chiang Mai Air Quality by Month.
Is Early March Better Than Late March?
Statistically, yes — but not reliably. In six of eight scored years, the second half of March had the heavier air pollution, as fire emissions build through the month with no rain to stop them. The exceptions are recent: early March 2021 and 2026 were already unhealthy, and mid-March 2026 was the month’s cleanest stretch. Booking the first half of March is not a safety strategy.
What Did March 2026 Actually Look Like?
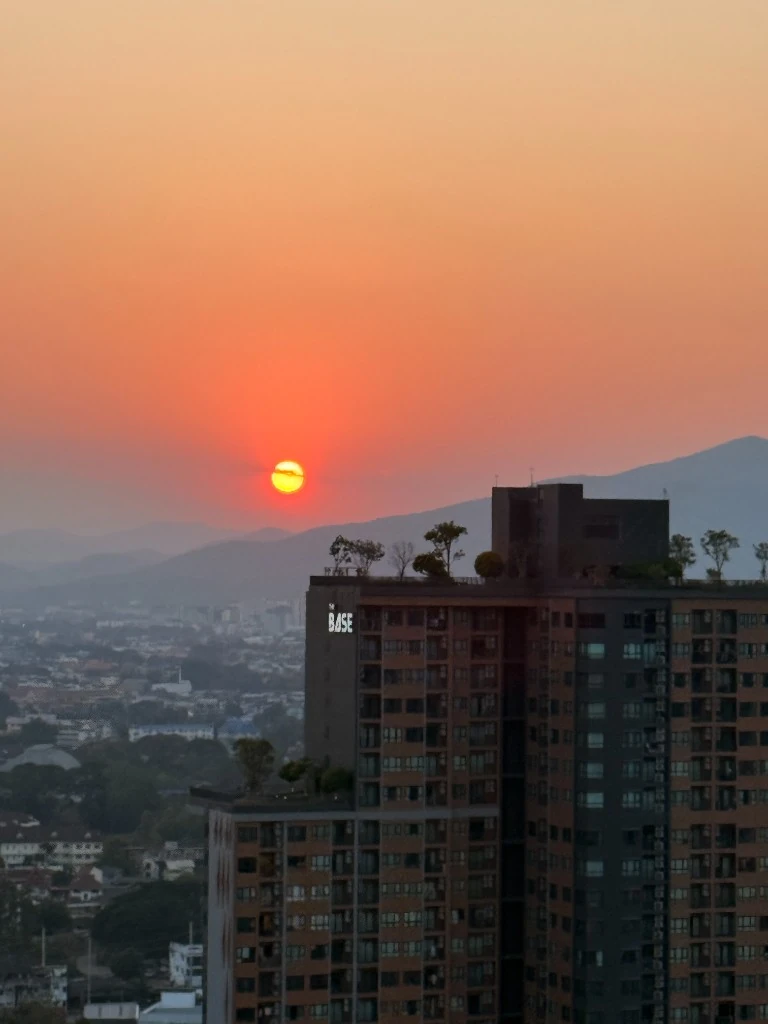
March 2026 was not uniformly bad — it broke into three distinct phases:
Table 3: March 2026 week by week
| Dates | Daily-average AQI range (AQI.in) | What happened |
|---|---|---|
| Mar 1–2 | building | Haze building after a dry February |
| Mar 3–6 | 121–158 | Early smoke episode; daily-average peak 158 on Mar 5; world #3 real-time on Mar 4 |
| Mar 7–10 | easing | Easing ahead of a weather shift |
| Mar 11–23 | 71–98 | Unusually clean window after winds and thunderstorms; PCD 24-hour PM2.5 about 15 µg/m³ at Suthep on Mar 23 — near the WHO 24-hour guideline |
| Mar 24–31 | 130–208 | Severe finale; real-time US AQI 224 (Mar 26) and about 233–263 with PM2.5 188.0 µg/m³ (Mar 30); world #1 for 4+ consecutive days into April 1 |
Daily-average AQI (AQI.in) and real-time AQI (IQAir) are different measures — see the PM2.5 vs AQI explainer above.
PCD 24-hour station readings tell the same story: 72.6, 57.7 and 50.3 µg/m³ (Chang Phueak, Suthep, Si Phum) on March 5. The daily check matters more than the calendar date.
How Much Does Chiang Mai’s March Air Quality Vary Year to Year?
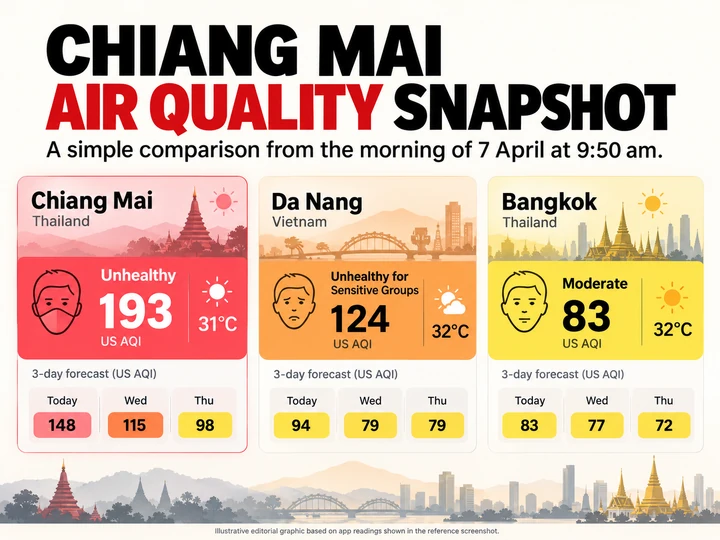
Enormously — witness the whiplash of the last two years. March 2025 was one of the mildest on recent record, roughly 45–51 µg/m³ depending on the monitoring network, in Chiang Mai’s cleanest recent year (annual average PM2.5 of 18.2 µg/m³, IQAir). March 2026 followed with 5,090 fire hotspots in Chiang Mai province from January 1 to March 31 (up 39% on the same 2025 period, per GISTDA via Thairath), world-#1 real-time AQI peaks, and — in the aftermath — the first disaster-zone declarations for the smoke crisis (April 1–4, 2026).
Table 1: Chiang Mai March PM2.5 by year
| March | Monthly average PM2.5 (µg/m³) | Monitoring network / source | Character of the month |
|---|---|---|---|
| 2019 | 98.7 | IQAir (World Air Quality Report) | Severe |
| 2020 | 94.1 | IQAir | Severe |
| 2021 | 83.3 | IQAir | Severe; early-March peak |
| 2022 | 39.9 | IQAir | Mildest recent March (La Niña) |
| 2023 | 97.8 | IQAir | Severe — worst recent year |
| 2024 | 71.6 | IQAir | Severe; April was worse |
| 2025 | ~45–51 | PCD monitors ~51 (SmogRank/OpenAQ); Plume Labs network ~45 | Milder (La Niña), but not clean |
| 2026 | No verified IQAir monthly mean yet; provisional PCD-monitor aggregation ≈34.6 | SmogRank (single source, unverified) | Early + late episodes, clean mid-month |
Values are monthly averages of PM2.5 concentrations (µg/m³), not AQI. IQAir and PCD-monitor networks use different sensors and station mixes, so values are not strictly interchangeable. The 2026 figure is a provisional single-source aggregation and may change.
For context, Chiang Mai’s annual-average PM2.5 across 2022–2025 ranged from 18.2 to 33.4 µg/m³ (IQAir) — so even a mild March runs at roughly double to triple a normal year’s average.
What Do Severe March Years Look Like Versus Milder Ones?
Table 2: Severe vs mild March years at a glance
| Severe March years (2019, 2023) | Milder March years (2022, 2025) | |
|---|---|---|
| March monthly-average PM2.5 | 98.7 / 97.8 µg/m³ (IQAir) | 39.9 µg/m³ (IQAir, 2022); ~45–51 µg/m³ by network (2025) |
| Daily-average AQI day-counts (AQI.in platform*) | 2023: 15 Unhealthy + 9 Severe days | 2022: 0 Unhealthy; 2025: 6 Unhealthy, 0 Severe |
| Full-year exceedance days at PCD station 36T** | 101 (2023) | 43 (2022) |
| Climate driver | El Niño / neutral; drought | La Niña rains persisting into the dry season; PCD forecast a milder 2025 |
| Worst real-time moment | US AQI 289, PM2.5 239 µg/m³ (29 Mar 2023) | No city day above the “Poor” band in 2022 |
| What it still felt like | World #1 live ranking; hospital surge (12,671 patients, Q1 2023) | Still roughly 3× the WHO 24-hour guideline (2025); regional haze alert (ASMC Alert Level 3) on 17 Mar 2025 |
*AQI.in band labels differ from US EPA labels: its “Poor” band (101–150) corresponds roughly to the EPA’s “Unhealthy for Sensitive Groups.” Counts are daily-average AQI on that platform. **Days above the Thai 24-hour PM2.5 standard, full-year counts. The standard tightened from 50 to 37.5 µg/m³ in June 2023, so cross-year comparisons are approximate.
“Milder” is relative. Even the mildest recent March (2022) still recorded 24 “Poor” days on AQI.in, and March 2025 averaged about three times the WHO 24-hour guideline. There is no clean March on record — only less bad ones.
Why Do El Niño and La Niña Change the March Outlook?
The year-to-year swing tracks the ENSO cycle. La Niña years (2022, 2025) bring rains that persist into the dry season, suppressing fires and washing out smoke — the PCD’s own 2025 pre-season forecast cited La Niña when predicting a milder haze season. El Niño and neutral years (2019, 2023) bring drought, more hotspots and severe haze. That is an actionable pre-trip signal, available months before you book:
- Check the current ENSO state (El Niño/La Niña/neutral).
- Read the PCD’s pre-season haze outlook.
- Watch early-season hotspot counts on GISTDA or NASA FIRMS — a fast-building fire count in January–February foreshadows a severe March.
Should You Visit Chiang Mai in March?
There is no honest yes/no answer — the correct frame is a conditional threshold: monitor the air daily and adjust activity rather than avoid the destination, the position five governments converge on (below). A March day can be world-#1 polluted or near WHO guideline, sometimes in the same week. If you come, manage exposure day by day; if your dates are flexible, January–February is climatologically cleaner.
Who Should Reconsider a March Trip to Chiang Mai?
Sensitive groups — people with respiratory or cardiac conditions (including asthma), pregnant travelers, young children and older adults — face real risk in a severe March. CDC guidance: sensitive groups avoid outdoor activity at US AQI 101 and above, a threshold a bad March day clears easily. The documented health burden: March 2021 was the peak hospital-admissions month in one peer-reviewed study (30,581 admissions); Q1 2023 brought 12,671 respiratory patients to Maharaj hospital alone; the 2023 episode cut hotel occupancy to ~45% against the ~90% expected.
What Do Official Travel Advisories Actually Say?
The CDC, US State Department, UK FCDO, Australia’s Smartraveller and the Government of Canada all advise monitoring local air quality daily and following official guidance; none advises avoiding Chiang Mai. Common threads: limit outdoor exertion when AQI is elevated, sensitive groups stay inside at US AQI 101+, wear a well-fitting N95 or KF94 (the WHO notes the community evidence base is limited, but a properly fitted respirator’s filtration is well established).
Is Escaping to Pai or Elsewhere in the North a Fix?
No. Pai, Mae Hong Son and the other northern valleys sit inside the same smoke system: Mae Hong Son recorded a Thai AQI of 350 on 11 March 2021 (worse than Chiang Mai’s 248 on that scale), and Pai reportedly exceeded 600 µg/m³ on some monitors on 31 March 2026 (monitor quality unverified). Only leaving the northern highlands changes your exposure class.
What Should You Check Daily in Chiang Mai in March?

Anchor on PM2.5 in µg/m³, not app colors, and run this sequence each morning:
Table 4: What to check each morning in March
| Step | Tool | What it tells you |
|---|---|---|
| 1 | Air4Thai (PCD official app) | Official Thai AQI + PM2.5 from regulatory stations (35T/36T) |
| 2 | AQICN Chiang Mai | The same PCD feed converted to US AQI, plus wind |
| 3 | IQAir | Hourly real-time AQI; the gap vs the 24-hour average shows the trend direction |
| 4 | NASA FIRMS or GISTDA fire portal | Hotspots upwind in the last 24 hours — tomorrow’s smoke |
| 5 | TMD forecast | Rain = clearing; calm and dry = accumulation |
| 6 | SERVIR AQ Tracker | 3-day modeled PM2.5 outlook |
| 7 | Doi Suthep sightline | Ground truth: if the mountain has vanished behind the haze, visibility confirms the instruments |
Decision rules: a 24-hour average above 37.5 µg/m³ exceeds the Thai standard; above roughly 55.5 µg/m³ corresponds to US AQI “Unhealthy”. On such days, stay indoors in a sealed, filtered room — indoor air otherwise tracks outdoor air closely (studies report an indoor/outdoor ratio around 0.9), while WHO-cited evidence shows air purifiers can cut indoor PM2.5 by 40–82%.
FAQs About Chiang Mai Air Quality in March
Is March a good time to visit Chiang Mai?
Climatologically the worst month for air quality, but not a write-off: severity varies by year and week, and five governments advise monitoring daily rather than avoiding the destination. See the visit-decision section above.
Does it rain in Chiang Mai in March?
Barely — it is the driest month, averaging about 13.5 mm. Rain is the reset button: the record-clean mid-March 2026 window followed winds and thunderstorms; without rain, smoke accumulates for weeks.
When does the burning season end in Chiang Mai?
Sustained relief comes with the rainy season, usually in May. Songkran (mid-April) is not a reliable all-clear — April 2023 and 2024 were both worse than their Marches, and 2026’s worst days ran into early April.
How can I protect myself from poor air quality in March?
On bad days: stay indoors in a sealed room with a HEPA air purifier, wear a well-fitting N95/KF94 outdoors, avoid strenuous outdoor exercise, and follow the daily-check workflow above. Sensitive groups should scale back outdoor activity whenever US AQI reaches 101+.
Sources
Historical data & monthly means
- IQAir 2020 World Air Quality Report (2020 monthly/annual means)
- IQAir 2022 World Air Quality Report (2022 monthly means; 2021 annual mean)
- IQAir 2023 World Air Quality Report (2023 monthly/annual means)
- IQAir 2024 World Air Quality Report (2024 monthly/annual means)
- IQAir Chiang Mai city page (March 2019 mean)
- IQAir newsroom, Thailand 2021 burning season (March 2021 mean)
- AQI.in, Chiang Mai Historical Air Quality Analysis (daily series and day-counts; platform labels differ from US EPA)
- SmogRank Chiang Mai history (PCD-monitor monthly means via OpenAQ)
March climatology & mechanisms
- Jainonthee et al., Aerosol and Air Quality Research (2011–2020 March climatology)
- NASA Earth Observatory, “Smoke Shrouds Northern Thailand”
March events
- Bangkok Post, 30 Mar 2026 (real-time AQI 263, PM2.5 188.0 µg/m³, world #1)
- Bangkok Post, 31 Mar 2026 (fourth consecutive day at #1)
- IQAir newsroom, 4 Mar 2026 (early-month episode)
- IQAir newsroom, 27 Mar 2026 (world #1 alert)
- Thairath English, 1 Apr 2026 (5,090 hotspots Jan–Mar 2026, +39%)
- Thairath English, 23 Mar 2026 (mid-March clean window)
- CNN Travel, 2023 (29 Mar 2023 peak and tourism impact)
- Bangkok Post, 30 Mar 2023 (Chiang Dao district readings)
- Xinhua, 14 Mar 2019 (Thai PCD AQI 309 — Thai scale)
- Prachatai English, Sep 2024 (station 36T exceedance days 43/101/80)
- ASMC, Review of Regional Haze Situation for March 2025 (Alert Level 3 on 17 Mar 2025)
- BBC, 1 Apr 2026 (disaster-zone declarations)
Standards, health & official guidance
- WHO global air quality guidelines 2021
- Nation Thailand (Thai 24-hour PM2.5 standard tightened to 37.5 µg/m³ from 1 Jun 2023)
- US EPA / AirNow AQI basics
- IQAir knowledge base (May 2024 US EPA breakpoint revision)
- CDC wildfire smoke guidance
- UK FCDO Thailand health advice
- US State Department Thailand page
- Australia Smartraveller Thailand
- Government of Canada Thailand travel advice
Daily-check tools
Stay updated
Get the Chiang Mai Brief
Useful local updates, new guides, openings and practical information for living in or visiting Chiang Mai.